
Airline Safety
Financial investing is an effective way to create monetary growth and appreciation. Stocks offer a return on investment when stock prices increase. The average annual stock market return is approximately 10% but vary greatly between each company (Royal & O'Shea, 2021). Though they have the potential to be very profitable, stocks can be volatile and can also contribute to financial loss. Though losses are inevitable, risk management can help mitigate them. One way to minimize the risk is through stock price forecasting.
Stock analysts are often employed by banks, investment firms, and analysis companies to make predictions about companies and their future performances. With access to company financial statements, quarterly meetings, company management and key customers, stock analysts conduct surveys and research to gain additional insight about the companies and how they are performing. Their findings are published in a report that includes projects of the company’s revenue, earnings per share, a 12-month target price, and a recommendation rating. The 12-month price target is what the stock price is forecasted to be in a year. The recommendation rating tells investing whether they should buy, sell, or hold. Though revenue and earnings per share projections are often accurate, price target and recommendation ratings are not always reliable, as forecasting short-term stock prices is difficult in a volatile market.
The goal of this project is to forecast stock prices to provide risk analysis to potential investors. I will be focusing on four companies in the communication sector: Disney (DIS), Comcast (CMCSA), Viacom (VIAC), and Netflix (NFLX). Though I do not have access to the same resources available to stock analysts, I will use historical stock prices to answer the following questions:
I obtained the historical daily stock price data for Disney, Comcast, Viacom, and Netflix using Yahoo Finance. All of the data was comprised of the following variables:
the date of the recorded stock prices
the highest cash value the stock reached on the given date
the lowest cash value the stock reach on the given date
the cash value of the stock when the stock market closes on the given date
the closing price in relation to other stock attributes
the number of shares that were traded on the given date
I decided to focus on the closing price for the majority of my analysis. I observed different time periods for gain a better understanding of the data. These time periods were the lifetime of the stock, the last 5 years (starting date of January 1, 2016), the last year (starting date of January 1, 2020), and the current (starting date of January 1, 2021). These timeframes were used to find the change in price and the average daily returns.
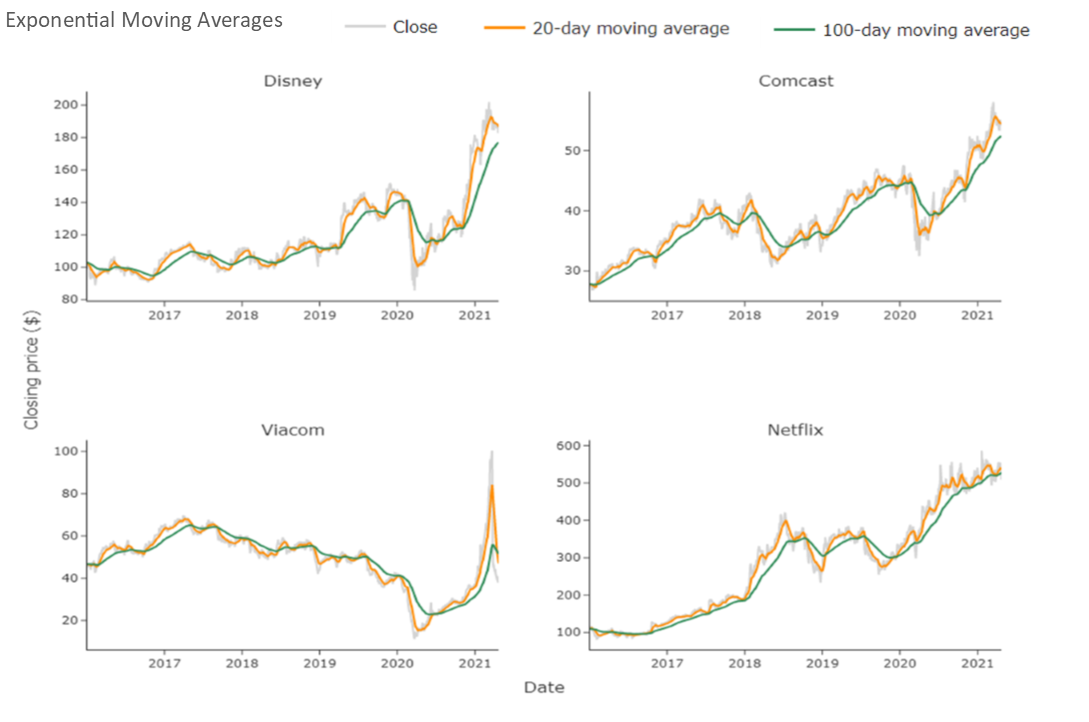
I observed the exponential moving average using 20-day and 100-day periods. I chose the exponential moving average because they give more weight to recent prices, allowing for them to capture trends in a faster way than simple moving averages (Sharma, 2019). Shorter time frames follow more closely to the actual stock prices than longer time frames. Therefore, the 20-day moving average may be more beneficial to a short-term investor and the 100-day moving average may be more beneficial to a long-term investor (Mitchell, 2021).
To determine the risk of investing in each company, I looked at two things: the dollar volume and the standard deviation of the daily percent change over the last five years. Stocks that are both thinly traded and low-priced increase the investment risk. According to Investor’s Business Daily, thinly traded stocks are those with trades fewer than 400,000 shares per day based on a 50-day average (Gondo, 2019). To account for thinly traded and low-priced stocks, I calculated the dollar volume of each stock to determine if any have added risk. Dollar volumes less than $20 million indicated increased risk. The standard deviation tells how far the investment fluctuates from its expected return. High standard deviations can indicate market volatility (Beers, 2021). Therefore, the greater the standard deviation, the greater the risk.
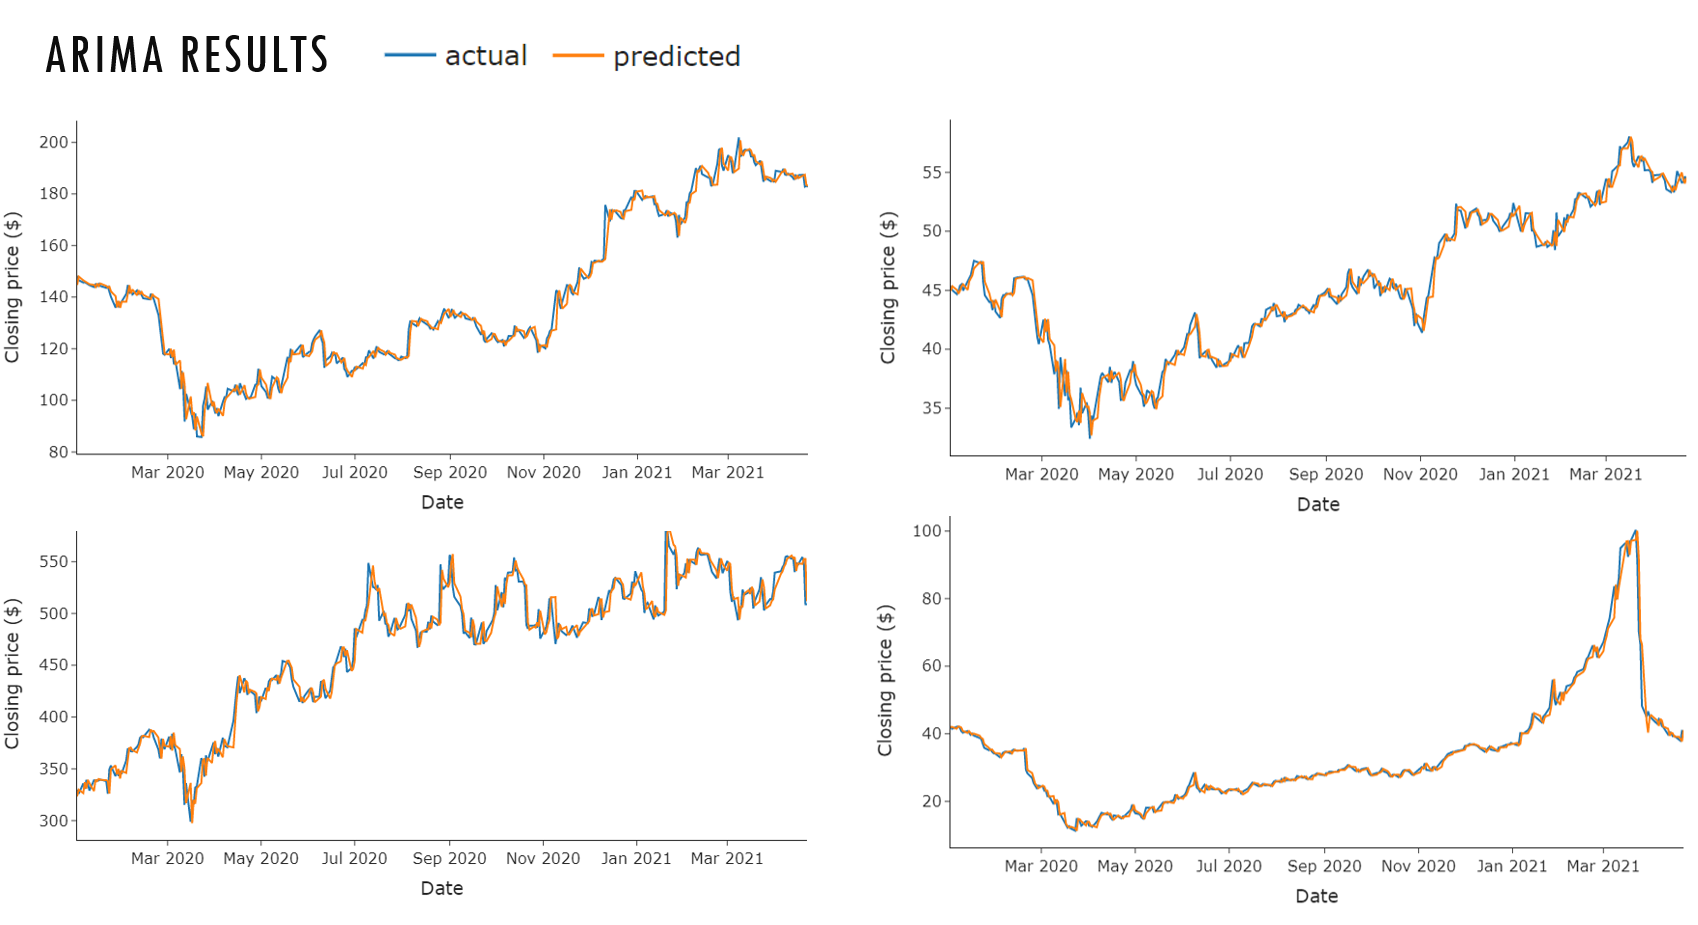
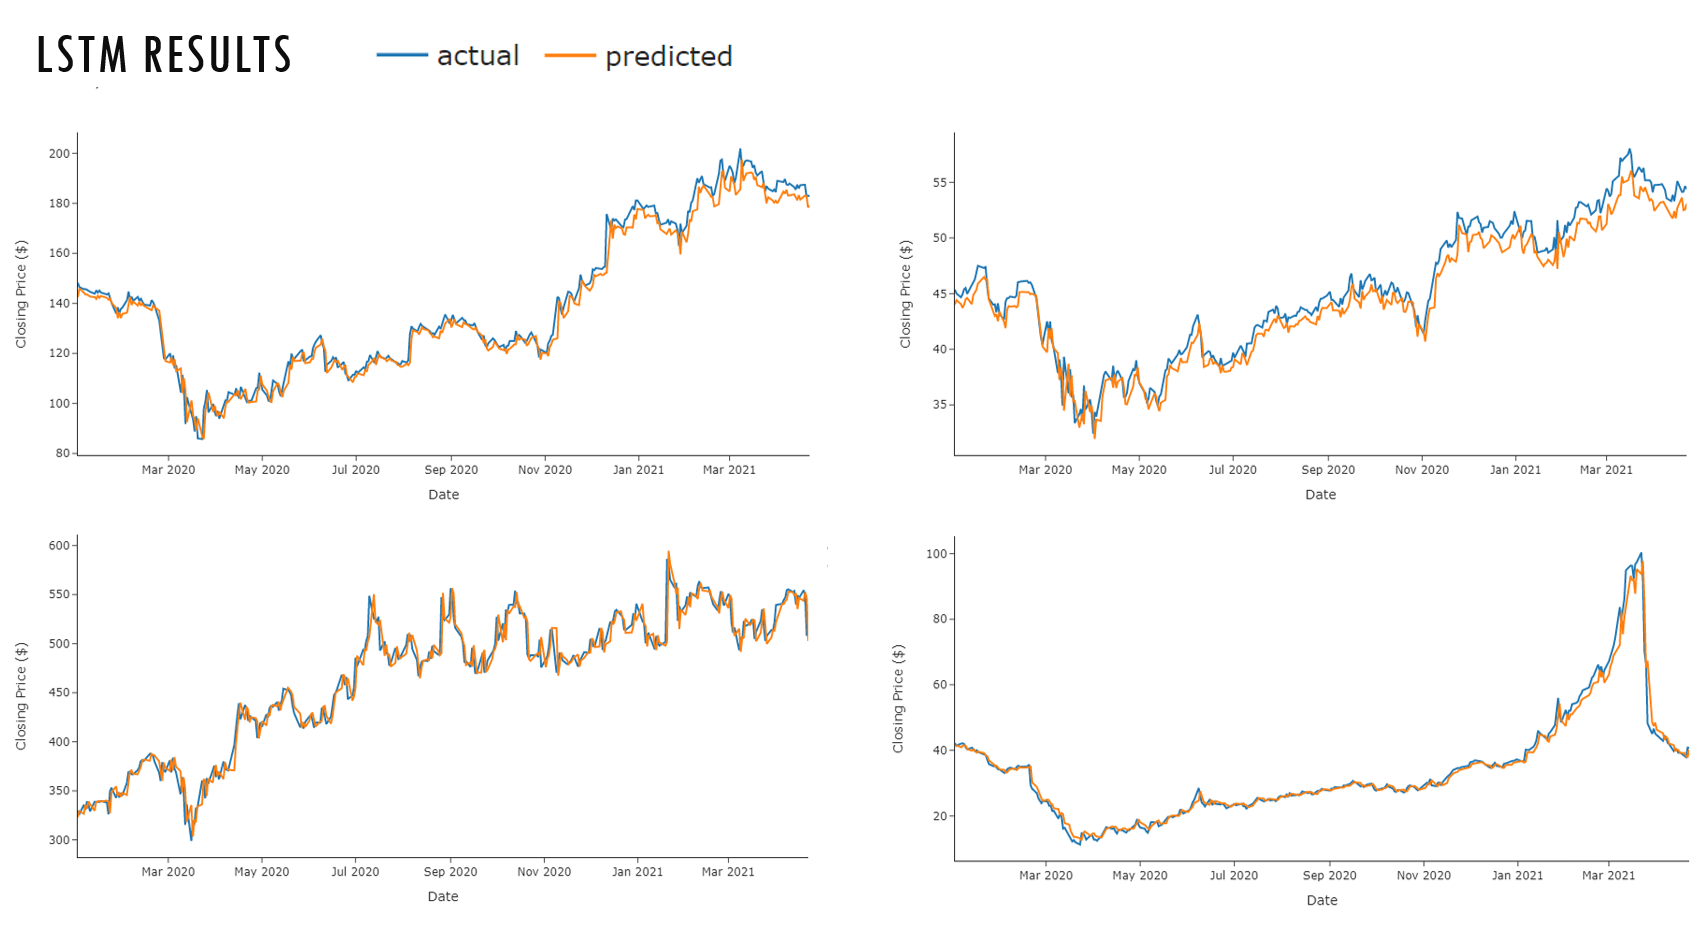
Finally, I trained and tested two models, Autoregressive Integrated Moving Average (ARIMA) and Long Short-Term Memory (LSTM). First, I split the data into a training and test sets. The training data consisted of closing stock prices from 2015 to 2019. The test data consisted of closing stock prices from 2020 through April 22, 2021. I used the root mean square error (RMSE) to evaluate the performance of each model. I chose the model with the lowest RMSE to forecast the 12-month price target for each company.
The changes in stock prices for each time period can be seen in Table 1. The lifetime amount of data varies by company. This is reflected in the lifetime changes of stock prices, with older companies having the largest changes. Disney stock first became available in January 1962, with a closing price $0.10 and a current price (as of April 22, 2021) of $182.76. Comcast stock was first available in March 1980, with a closing price of $0.10 and a current price of $54.40. Netflix stock first became available in May 2002, with a closing price of $1.20 and a current price of $508.78. Finally, Viacom stock became available in December 2005, with a closing price of $26.70 and a current price of $40.73. Netflix stock prices increased the most over the last year and last five years, while Viacom saw a decrease in stock prices. However, Viacom has the largest increase in stock prices in the current year.
| Company | Lifetime | Last 5 Years | Last Year | Current Year |
|---|---|---|---|---|
| Disney | 196610.7% | 77.5% | 23.3% | 2.9% |
| Comcast | 55668.6% | 95.5% | 19.9% | 7.7% |
| Netflix | 42424.9% | 362.7% | 54.3% | -2.7% |
| Viacom | 52.5% | -12.7% | -3.2% | 11.3% |
The average daily return of each company can be seen in Table 2. Netflix stock received greater daily returns for all time periods, except for the current year. Viacom has been the leader in daily returns so far this year.
| Company | Lifetime | Last 5 Years | Last Year | Current Year |
|---|---|---|---|---|
| Disney | $0.0007 | $0.0006 | $0.0011 | $0.0003 |
| Comcast | $0.0009 | $0.0006 | $0.0008 | $0.0006 |
| Netflix | $0.0019 | $0.0014 | $0.0018 | -$0.0004 |
| Viacom | $0.0005 | $0.0003 | $0.0011 | $0.0031 |
The exponential moving averages over the last five years can be seen in Figure 1. The 20-day moving average follows closer to the actual price, whereas the 100-day moving average provides a better indication of the overall trend. Disney, Comcast, and Netflix show an increasing trend, while Viacom decreases in 2021.
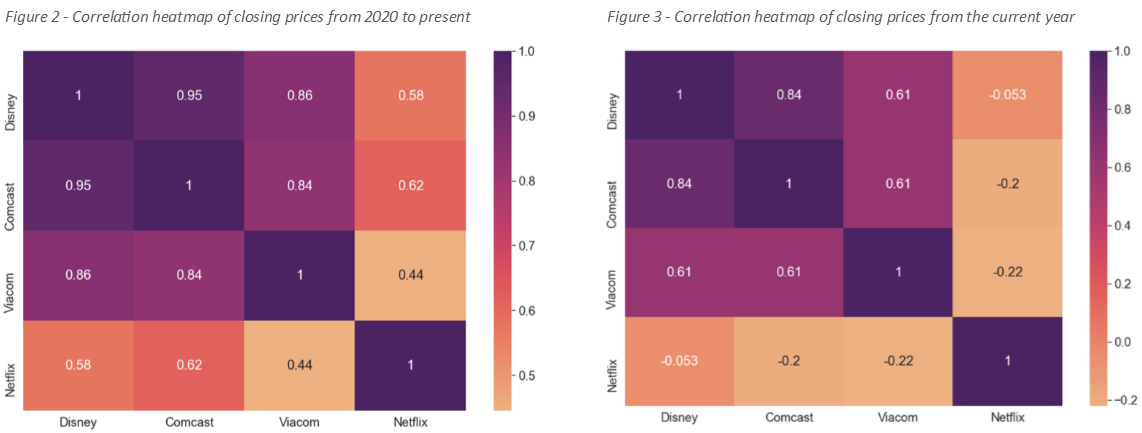
I observed the correlation of the closing prices from the last year between each company. Disney and Comcast were highly correlated, with a correlation coefficient of 0.95. Disney and Viacom are also highly correlated with 0.86, as well as Comcast and Viacom with 0.84. The other relationships can be seen in correlation heatmap in Figure 2. I also looked at the correlation of closing prices over the current year. The relationship between Disney and Comcast remains highly correlated at 0.84, but not as high as the previous year. The other relationships can be seen in Figure 3.
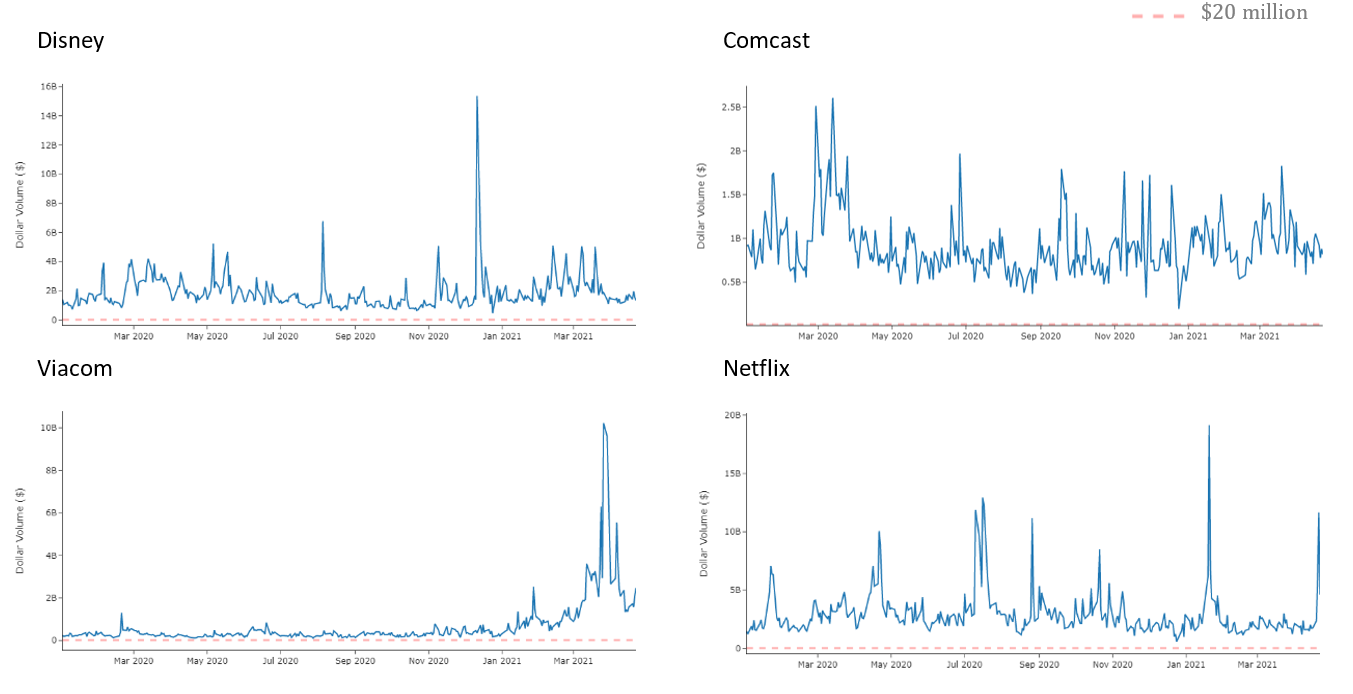
I calculate the dollar volume for each company by multiplying the closing cost by the volume of shares traded each day. Figure 4 shows the dollar volume from 2020 to the present. Over the past year, each company has maintained a dollar volume exceeding $20 million dollars, as indicated by the red, dashed line. Therefore, the increased risk associated with thinly traded and low-priced stocks does not apply.
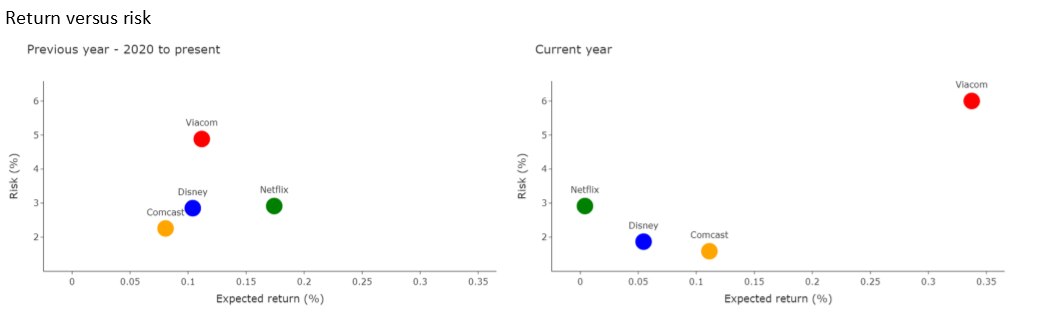
Next, I looked at the daily returns. I calculated the mean and standard deviation of the daily percent change for 2020 to present day and the current year. The results can be seen in Figure 5. The mean represents the expected return and standard deviation represents the risk. While the risk associated with Disney stock decreased in the current year, so did the expected return. Viacom stock exhibited the opposite with an increase in both the expected return and risk. Comcast stock experienced an increase in expected return and a decrease in risk. The risk of investing in Netflix stock remained unchanged; however, the expected return decreased.
After splitting the data, I trained the ARIMA and LSTM models. The results of each model can be seen in Figure 6 and Figure 7. The ARIMA model outperformed the LSTM model, with lower root mean square errors for all companies. The model performed best on the Comcast stock data, with a RMSE of 0.91.
Using the ARIMA model, I forecasted the 12-month price target for each company. These forecasts can be seen in Table 3. I also noted the percent change from the current price to the forecasted price target.
| Company | Current Price | Price Target | Percent Change |
|---|---|---|---|
| Disney | $182.76 | $203.57 | 11.4% |
| Comcast | $54.40 | $60.57 | 11.3% |
| Netflix | $508.78 | $618.80 | 21.6% |
| Viacom | $40.73 | $38.94 | -4.4% |
Based on the results of my analysis, I would suggest investing in Comcast stock. I determined Comcast had the lowest associated risk. It also had the lowest RMSE of 0.91, which means my predictions were off by an average of $0.91. However, I would also suggest to proceed with caution. Stock price forecasting is one of many risk management strategies. Most investment professionals agree that portfolio diversification is the most important strategy to reach financial goals while minimizing risk (Lioudis, 2021). Portfolio diversification involves dividing investments across various sectors, industries, and investment types. Overall gains across an investment portfolio will mitigate losses of a single asset. It is also important to be aware of the risks that can affect stock prices, such as those associated with the economy, an entire industry, an individual company, or the entire stock market. Economic risks may include inflation or deflation, increases in unemployment, and interest rate fluctuations. Industry risks may include changes that affect an entire industry’s market, such as developments in technology. Company risks may include actions within a specific business that can make it more or less vulnerable to economic and industry risks (Siegel & Yacht, 2012).
Airline Safety

Disneyland Review Analysis
Credit Card Churn

Credit Card Churn

Health Insurance Cost
I would love to hear from you.