
Airline Safety
Credit card companies generate most of their revenue through fees charged to their cardholders. These fees may include interest charged to balances carried over from the previous month, late fees if the minimum payment amount is not paid by the due date, an annual fee to keep the account open, cash advance fees charged when cards are used to obtain cash, balance transfer fees charged when the balance of one card is transferred to another, etc. In 2019, U.S. credit card companies made approximately $180 billion through customer fees alone (Egan, 2020).
Customer attrition, or customer churn, can be defined as the rate at which customers stop doing business with a company. Customer churn is an important metric to consider since it is generally more expensive to acquire new customers than to retain existing customers. By determining which factors contribute to customer churn, the company can identify individual cardholders who are likely to cancel their credit card. In turn, the company can extend a retention offer to these customers to encourage them to retain their card.
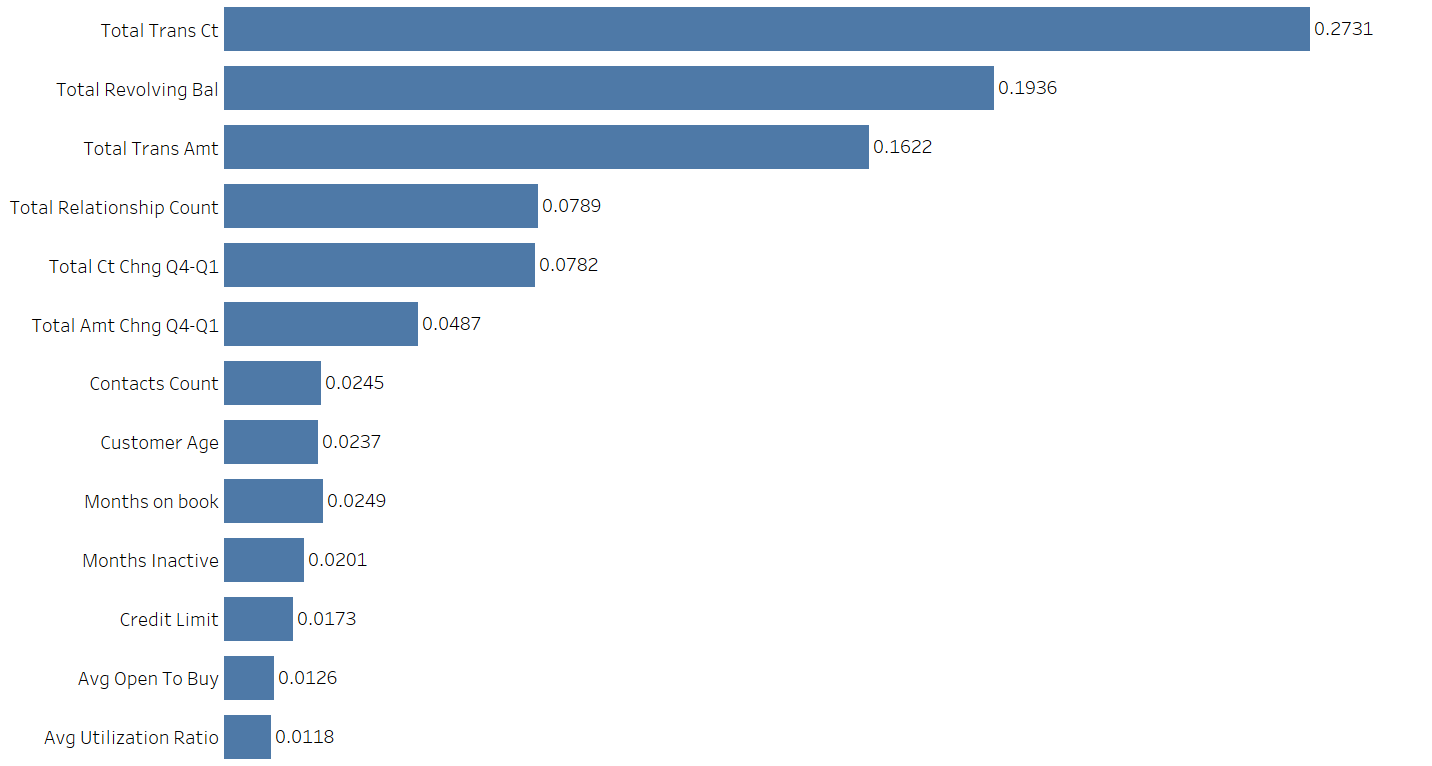
I obtained the Credit Card Customers dataset from Kaggle, which contained over 10,000 credit cardholder records. It contained 20 variables, including the target variable Attrition_Flag – a categorical variable with binary classes, Existing Customer and Attrited Customer. First, I split the data into a training, validation, and test sets. The training set contained 70% of the data and the remaining 30% was split evenly between the validation and test sets. After converting the categorical variables, I used the training data and a decision tree to determine variable importance. The selected the variables that represented 97% importance, as seen in Figure 1. Using these variables, I trained and fit five different classification models on the validation data. To evaluate the models, I used the Area Under the Precision-Recall Curve and Negative Log-Loss. The Area Under the Precision-Recall Curve is stable under class-imbalance. Therefore, if the number of cardholders who cancel their account makes up a small percentage of the dataset, this metric will allow me to focus on the trade-off of precision and recall instead of giving credit for true negative predictions that often overwhelm the set of predictions. This allows for additional requirements to potentially quantify the impact of Type 1 (customers predicted to cancel their card but do not) and Type 2 (customers predicted to keep their card but cancel) errors to set a threshold of prediction. Average precision is a metric with scores between 0 and 1, where higher is better. Negative Log-Loss uses calibrated probabilities to assess how confident and correct the model is on average. It heavily penalizes confident and wrong predictions. Negative Log-Los is a metric of positive numbers, where lower is better. I also noted the accuracy of each model. The results can be seen in Table 1.
| Classification Model | AUC Precision-Recall | Log Loss | Accuracy |
|---|---|---|---|
| Naive Bayes | 0.551 | 3.16 | 0.908 |
| Decision Tree | 0.672 | 2.23 | 0.935 |
| Random Forest | 0.789 | 1.36 | 0.961 |
| Gradient Boosting | 0.823 | 1.14 | 0.967 |
| eXtreme Gradient Boosting | 0.840 | 1.02 | 0.970 |
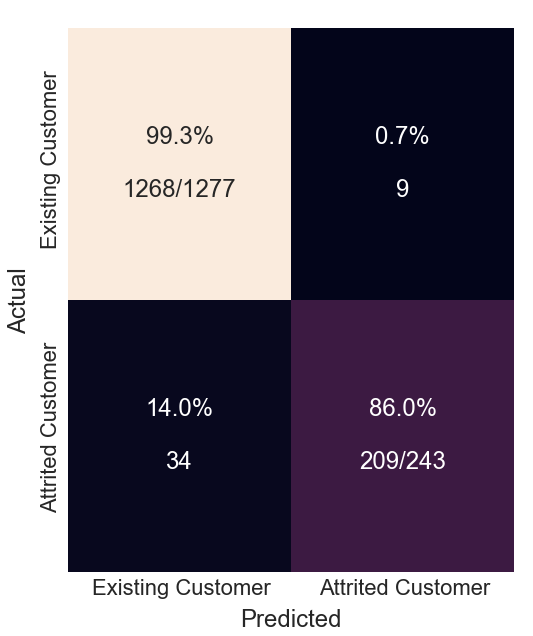
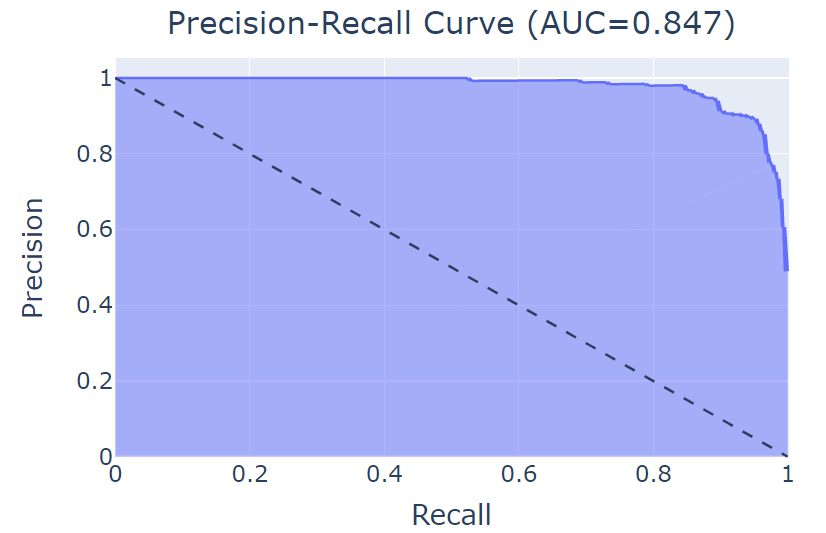
The eXtreme Gradient Boosting classification model performed better than the other models. Therefore, I concatenated the training and validation data and performed a cross-validation randomized grid search to choose the best parameters. The fine-tuned eXtreme Gradient Boosting model was fit on the test data and produced the results seen in Table 2. The classification results can be observed in the confusion matrix, Figure 2. Of the 1520 records in the test data, 209 customers were correctly classified and 9 were incorrectly classified as closing their account. Furthermore, 34 customers were incorrectly classified as existing cardholders but have closed their account. However, approximately 86% of customers at risk of churn were identified. The credit card company can extend retention offers to these cardholders; however, the additional 14% represents missed opportunity. The Area Under the Precision-Recall Curve can be seen in Figure 3.
| Classification Model | AUC Precision-Recall | Log Loss | Accuracy |
|---|---|---|---|
| eXtreme Gradient Boosting | 0.847 | 0.98 | 0.972 |
Once cardholders that have been identified as Attrited Customers, the company must decide how they will proceed with extending retention offers. It may choose one or multiple approaches to compare the effectiveness of each. Based on the responses of each cardholder, further analysis through uplift modeling can be conducted to determine which customers are most likely to respond to the retention offer.
Airline Safety

Disneyland Review Analysis

Credit Card Churn

Credit Card Churn

Health Insurance Cost
I would love to hear from you.