
Airline Safety
Employee attrition is the natural process in which employees leave the workforce. This can include retirement and voluntary, or involuntary, separations from a company. Whether an employee chooses to leave a company on their own accord, high attrition rates can be harmful to a company and can lead to the following:
The XYZ Company employs over 4000 employees, with an annual attrition rate of approximately 16%. It is in the company’s best interest to retain their current employees. Thus, the XYZ Company is interested in understanding the factors that affect employee attrition to determine which employees are at risk. This will allow the company to reduce the attrition rate by implementing different techniques and incentives, such as additional training, wage increases, and opportunities for promotion.
The HR Analytics Case Study dataset contains records of the 4410 XYZ Company employees. I will be creating two classification models to understand if the dataset has the ability to accurately classify whether an employee will stay or leave the company. This is a supervised learning problem with binary classification, where labels “yes” and “no” indicate whether an employee has left the company or not, respectively. I will be using the recall score to evaluate the performance of the two models. Recall is an important metric to consider, as I would like to minimize Type 2 errors. These errors indicate false negative predictions, which cause employees who are at risk of leaving to go undetected. This metric has a score between 0 and 1, where higher is better.
First, I split the dataset into training and testing sets. Using the training set, I converted all categorical features into dummy variables using one hot encoding. I also converted the target into binary variables, where “no”=0 and “yes”=1. Then, I performed feature selection using two different techniques, recursive feature elimination using cross-validation (RFECV) and ANOVA F-values, to determine which factors impact employee attrition the most. I performed RFECV using both a Random Forest Classifier and a Decision Tree Classifier as the estimators, and recall as the scoring metric. The Random Forest Classifier estimator selected two features, age and monthly income. The Decision Tree Classifier estimator selected four features: age, distance from home, monthly income, and years at company. Next, I used the ANOVA F-values to remove irrelevant features. I wanted to select the k features with the highest F-values. To do this, I used a loop to include values of k ranging from 2 to the total number of features. Then, I trained Random Forest Classifiers and Decision Tree Classifiers for each value of k to determine which value provided the best recall score. For both models, k values greater than 9 began to increase only minimally. Therefore, I chose to keep the k=9 best features. These features were: age, number of companies worked, training times last year, years at company, frequent business travel, rare business travel, job role of Research Director, marital status of married, and marital status of single.
Next, I performed model selection. I trained Random Forest and Decision Tree Classifiers with different parameters on the three feature subsets obtained during feature selection. Both models performed best when using the subset with the features: age, distance from home, monthly income, and years at company; however, the Decision Tree Classifier performed the best with a recall score of 0.88 when using the following parameters: criterion=gini, max_depth=19, min_samples_leaf=1, min_samples_split=2, and splitter=random.
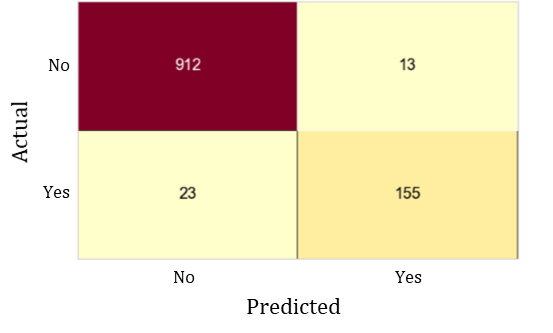
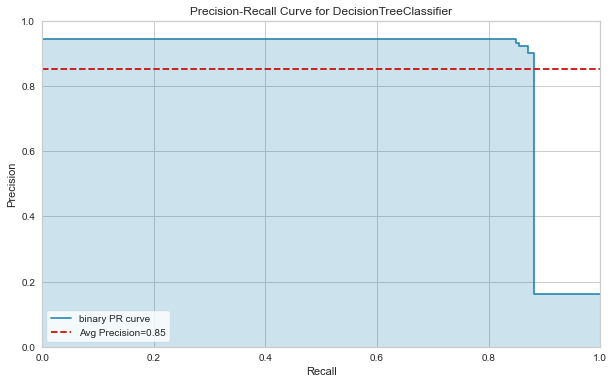
I used the Decision Tree Classifier to predict whether or not an employee left the company based on age, distance from home, monthly income, and years at company using the testing data. The model made classification predictions as seen in confusion matrix in Figure 1, providing a recall score of 0.87. This is very close to the recall score obtained during my experiments. Therefore, I am confident that this model will perform similarly on future employee data. I also wanted to look at the Area Under the Precision-Recall Curve, in which a high area indicates both high recall and high precision. I was interested in this metric because it is stable under class-imbalanced and shows the trade-off between precision and recall. The model provided an average precision score of 0.85, which can be seen in the Area Under the Precision-Recall Curve in Figure 2. This value further shows that the model performed well.
Though the results show that the model performed well, there is room for improvement. I handled class-imbalance by looking at the area under the precision-recall curve. However, I could have performed other techniques, such as random oversampling or Synthetic Minority Oversampling Technique (SMOTE) to generate new data for the minority class. I could also consider using different models. Though decision trees frequently perform well on imbalanced data, tree ensembles usually outperform singular decision trees. Though the Decision Tree Classifier performed better than the Random Forest Classifier, I could test other models, such as Gradient Boosted Trees or Extremely Randomized Trees.
Airline Safety

Disneyland Review Analysis

Credit Card Churn

Credit Card Churn

Health Insurance Cost
I would love to hear from you.